An overly optimistic market? Contextualising macroeconomic forecasts
An article written during my time at the Australian Shareholders Association. Originally published in EQUITY magazine (Vol. 34, No. 8, Oct 2020: 11-12). Now available at Informit. Authored by John Cowling and myself.
Navigating the state of an economy can be difficult. With a plethora of indicators for investors to look towards when determining the macro state of an economy, we continue our search as prudent investors to qualify what matters, and cut out the distracting “noise”.
In an attempt to ease this struggle, we introduce an American-based non-profit organisation named The Conference Board (‘The Board’). The Board produces what they call a Leading Economic Index (LEI); a composite set of indicators that forecast movements in the business cycle. By compiling indicators, applying an adjustment factor and indexing them, the Board is able to smooth out volatility usually seen in individual indicators and provide an overall picture of aggregate demand.
This index is relied upon by the US Department of Commerce’s Bureau of Economic Analysis (BEA), and in turn, is used by the US Federal Reserve in their analysis.
How is this useful compared to conventional macroeconomic measures?
This leading index gauges the future direction of economic activity, whether it be a boom or bust. The indicators captured in the index shift in advance of conventional measures and are used to accurately predict turning points and inflections in the business cycle. Such an important foretelling has continued to hold true since the index was developed – this is captured quite visually (and conveniently) in the figure below illustrating America’s index:
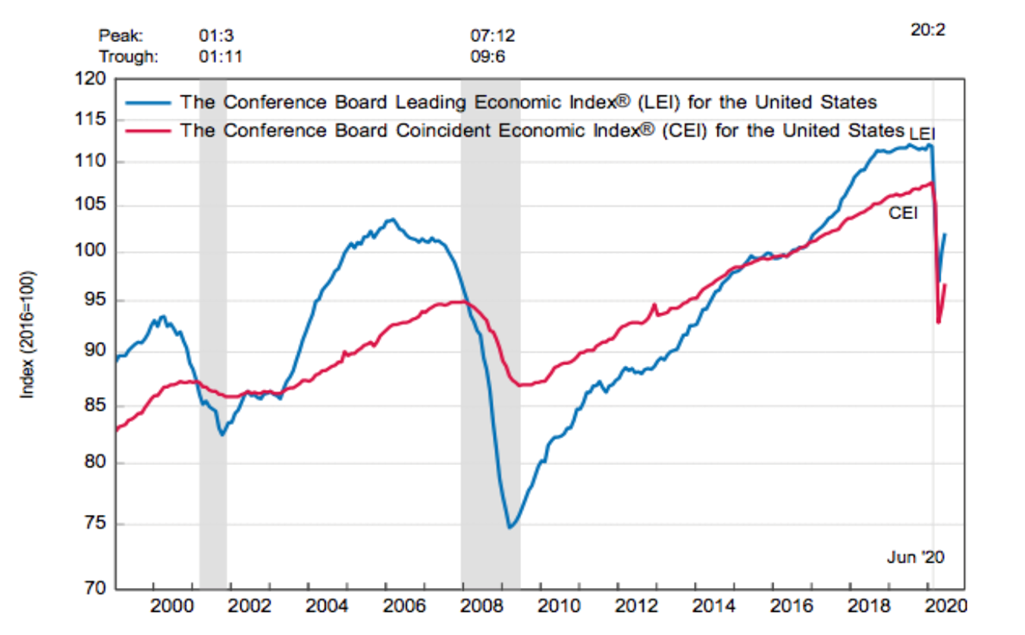
The greyed out areas represent times of recession. We see that recessionary periods are preceded by downward movements in the LEI many months before they occur. The Coincident Economic Index (CEI) is a similarly produced index using indicators that capture the real and live state of the economy, including household disposable income, industrial production, retail trade and employment. The CEI tends to coincide with current aggregate demand, serving as a backdrop to the LEI that, in nature, looks forward.
The LEI in Australia is a basket of seven forward-looking indicators. These include: yield spread, share prices (All Ordinaries S&P/ASX 200), M3 money supply, building approvals, rural goods exports, sales to inventory ratio, and gross operating surplus. These indicators are dominantly driven by confidence. Sentiment in the market is thus captured by the LEI.
The time lag and “rear mirror vision” bias that most performance indicators suffer from is effectively bypassed.
What’s happening in the index now?
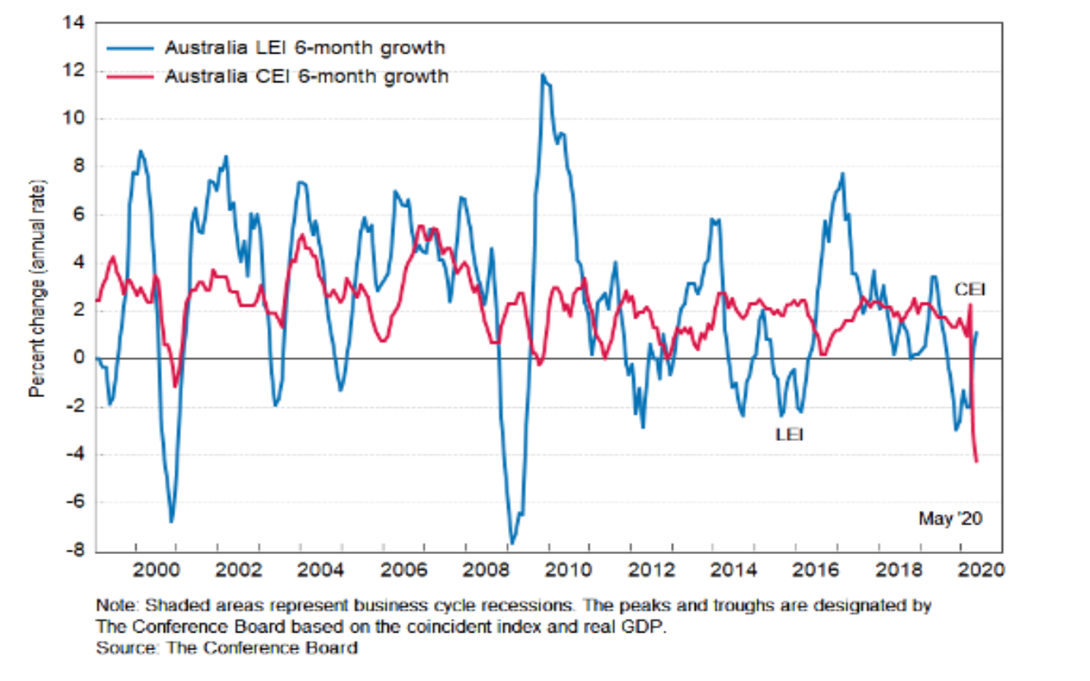
The figure above depicts the percentage change in the LEI and CEI of the Australian economy as of May 2020. To reiterate the point aforementioned, the LEI can be seen to reflect sentiment in the market. Interestingly, we see the LEI shoot up from November 2019 to May 2020 from 106.5 points to 107.1, a 0.6% increase despite the CEI steeply declining by 2.2%, entering us into a recession. Expectations of the future are rosier than the present circumstances.
So, why are the indexes now moving in opposite directions? We clearly see that in America, an unexpected exogenous demand shock, such as the COVID pandemic, caused both indexes to abruptly fall, and the GFC threat is seen to have prompted a more pessimistic market – so why is our market such an exception? We cannot presume that the decrease in the LEI before November 2019 was a prediction of the current CEI decline as the index cannot predict an unexpected demand shock; this was rather a reflection of the lackluster economy at the time being upheld by population growth.
The answer lies in the share market. One of the most recent and largest inclines in the LEI from March to April 2020 was driven by an increase in share prices. Equity flows are returning positive and shifting towards mega cap growth type classes. There is optimism in the stock market.
The American market similarly is more optimistic than what the current employment, household disposable income, industrial production and retail trade all dictate, evidenced by a premature increase in the LEI before the CEI.
This optimism is dangerous. With a looming US election and increasing uncertainty about lockdowns, investors should proceed with caution.
Interpreting the data
Despite its success in predicting recessions, readers must interpret declines in the LEI alongside the broader economy.
If we look at Australia during the GFC, we see the CEI, being the actual assessment of output, remaining resilient despite a steep decline in the LEI. Quick expansionary fiscal and monetary policy has subverted sentiment in the Australian economy, causing the LEI to quickly rebound. In other words, Labor’s fiscal stimulus policies (think insulation batts in the roof and new school halls) worked to dispel the chance of a recession.
To assess whether a turning point in the LEI represents an inflection in the economy, The Board suggests that readers consider the 3 D’s – duration, depth and diffusion, with diffusion relating to the proportion of components that rise or fall. Please note that the index is updated monthly, although its data is 2 months behind the present.
Conclusion
The Board’s indices are useful tools to help us decide for ourselves whether a recession is approaching. Although, as we venture into a world of uncertainty, opportunistic speculation, at least for the time being, may be to the detriment of investors worldwide.
About the Authors:
John Naoom is an ASA intern currently studying a Bachelor of Economics/Bachelor of Laws at UTS.
John Cowling is the CEO of ASA.